Analytics
Analytics provide a comprehensive view of your chatbot's performance and interactions, offering insights into various metrics and data to help you understand and optimize the chatbot's effectiveness.
Refresh Data Before starting work with the dashboard, it is recommended to refresh data to ensure you have the most up-to-date information. Click the Refresh button located in the upper-right corner of the dashboard to update data.
Selecting Data Span for Analytics To start analyzing data, select the desired date range in the upper left corner. You can either type the date manually or select it from the calendar by clicking on the calendar icon.
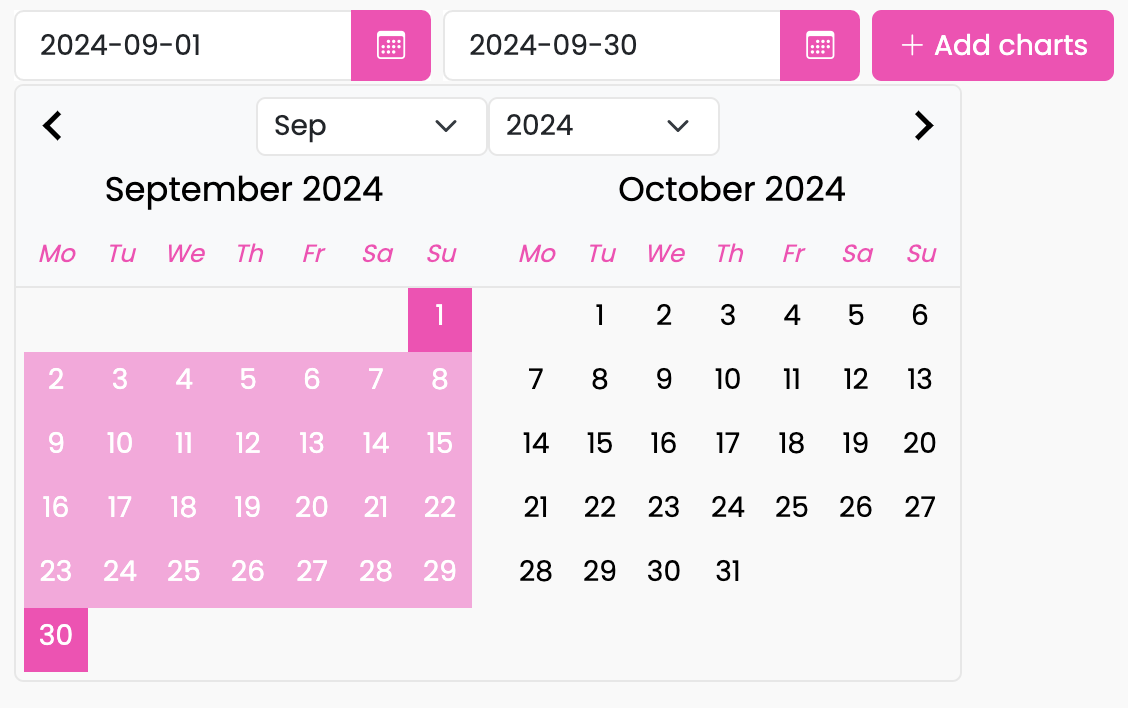
Dashboard personalisation
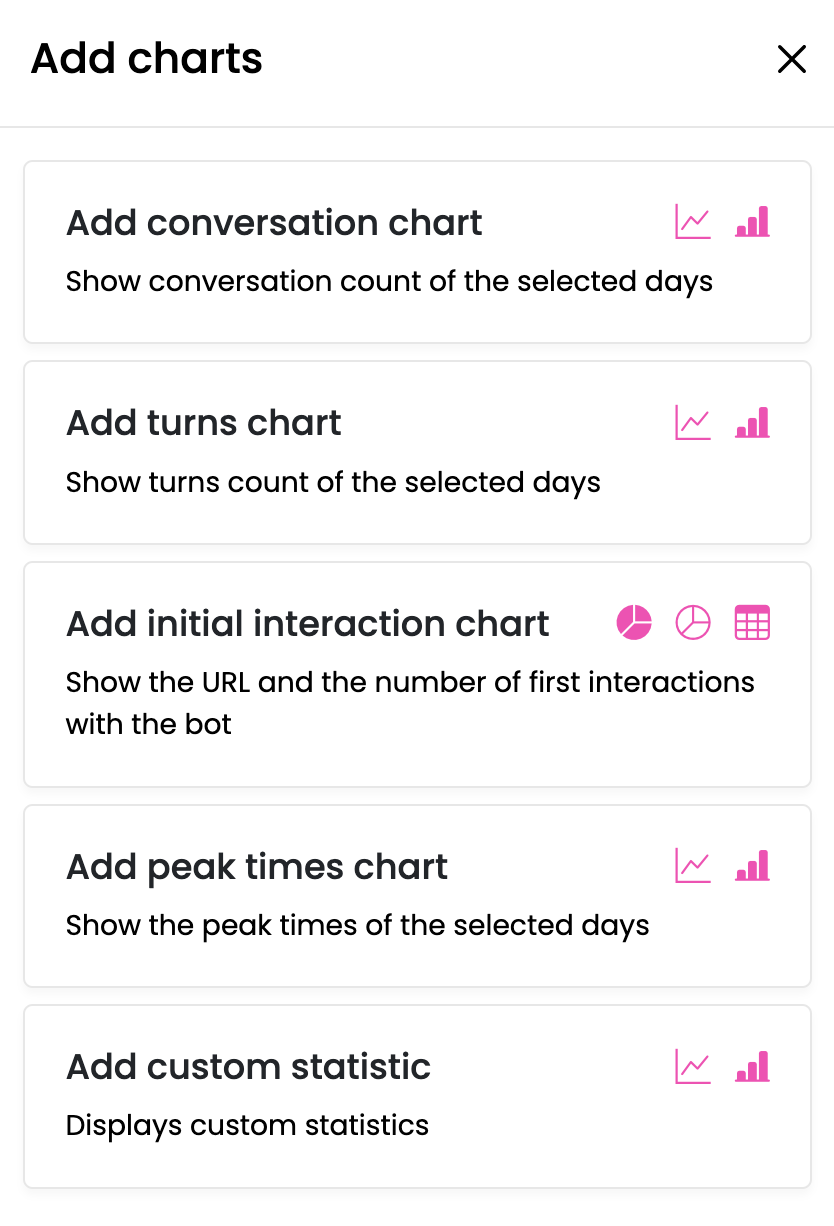
The Dashboard includes default charts, but you can customize it by adding additional charts:
- Click the Add Charts button on the right to the date settings.
- Choose your desired chart from the list provided.
To delete a chart from the dashboard:
- Click the menu icon (three vertical dots) in the upper-right corner of the chart.
- Select Delete from the dropdown menu.
- Confirm the deletion by clicking Remove or cancel the operation by clicking Cancel.
To change the view of a chart:
- Click on the menu icon (three vertical dots) in the upper-right corner of the chart.
- Select a desired view option from the dropdown list. Each chart type will have its own set of options (Line chart, Bar chart, Pie chart, etc.)
To change the size of a chart and modify the dashboard layout:
- Resize the chart: Position your cursor on the border or corner of the chart. Click and drag to resize the chart to your desired dimensions, making it either larger or smaller.
- Move the chart: Click and hold the chart, then drag it to a new position on the dashboard. Release the mouse button to drop the chart in the desired location.
Types of charts
-
Conversations: Displays the number of initiated chats for the selected date range.
-
Turns: Represents the total number of interactions between the user and the chatbot within a conversation. Each interaction consists of a user message and a corresponding bot response.
-
Initial Interaction: Shows the URLs and the number of initial interactions with the bot. This chart can be illustrated using a pie chart or donut chart to show the percentage distribution of initial interactions across different URLs.
-
Peak Times: Visualizes the peak times of activity for the selected date range, indicating the periods of highest user engagement with the chatbot.
-
Add custom statistic: The
add_custom_statisticmethod allows you to create or update custom statistics by incrementing their values. This method is particularly useful for tracking metrics or performance indicators specific to your use case.
(method) def add_custom_statistic( name: str, value: int = 1 ) -> None
Increment a statistic by a given value. This method is used to increment a statistic. The statistic is incremented by the given value.
Args: name (str): Name of the statistic value (int, optional): Value to increment the statistic by. Defaults to 1.